Dashboard Overview
Complete guide to GramMonetize Dashboard with real-time analytics, subscription metrics, and revenue tracking.
On this page
Dashboard Overview
The GramMonetize Dashboard is your central command center for managing Telegram subscriptions, tracking revenue, and monitoring user activity in real-time.
Real-time Analytics
Monitor subscription performance with live updates. All metrics refresh automatically without manual intervention.
Revenue Tracking
Track earnings by payment method, subscription plan, categories, and payment types with detailed breakdowns.
Visual Insights
Interactive charts and graphs help you understand trends and make data-driven decisions.
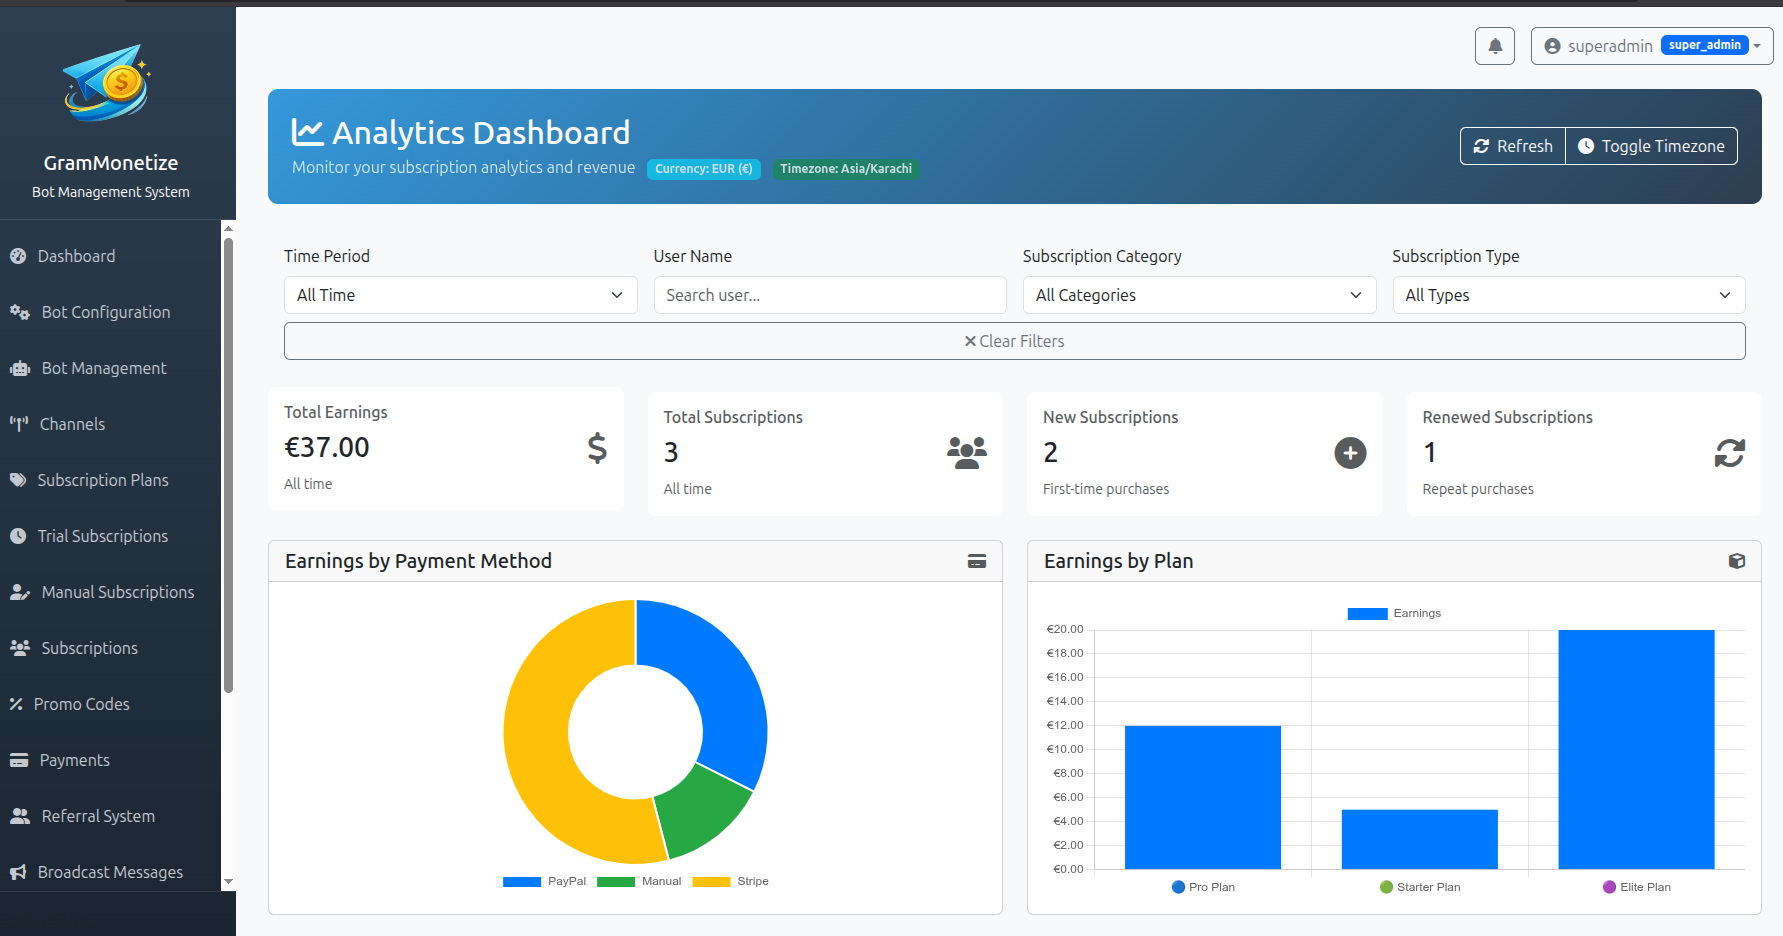
Key Metrics
The dashboard displays four primary metrics that give you an instant overview of your subscription business performance:
Total Earnings
Cumulative revenue from all subscriptions
Total Subscriptions
All active and historical subscriptions
New Subscriptions
Subscriptions created this month
Renew Subscriptions
Auto-renewed subscriptions
| Metric | Description | Business Impact | Update Frequency |
|---|---|---|---|
| Total Earnings | Sum of all subscription revenue from all payment methods | Track overall business growth and revenue trends | Real-time |
| Total Subscriptions | Count of all active and historical subscriptions | Measure market penetration and user base size | Real-time |
| New Subscriptions | Subscriptions created in current period (today/this month) | Monitor acquisition efforts and marketing effectiveness | Daily summary |
| Renew Subscriptions | Auto-renewed subscriptions (active renewals) | Gauge customer retention and subscription health | Real-time |
Analytics Charts
GramMonetize provides comprehensive analytical charts to help you understand your revenue streams and subscription patterns.
Earning by Payment Method
Visual breakdown of revenue across different payment gateways:
- Stripe: Credit/Debit card payments
- PayPal: PayPal account payments
- Manual: Bank transfers and offline payments
- Other: Alternative payment methods
Earnings by Plan
Compare revenue contribution from different subscription plans:
- Identify your most profitable plans
- Track plan adoption rates
- Optimize pricing strategies
- Identify upsell opportunities
Earning by Category
Revenue segmented by channel categories or content types:
- Educational: Courses, tutorials, learning materials
- Entertainment: Movies, music, games
- Business: Tools, resources, services
- Other: Miscellaneous categories
Categories help you understand which content types generate the most revenue.
Earning by Subscription Type
Comparison of revenue from different subscription origins:
Automated Payments
- Stripe subscriptions
- PayPal recurring
- Auto-renewals
Manual Payments
- Bank transfers
- Cash payments
- Other offline
Track automation efficiency and manual payment trends.
Daily Earning Trends
Track revenue patterns over time with interactive line charts:
Features:
- Date Range Selection: View data for 7, 30, or 90 days
- Interactive Chart: Hover over points for exact values
- Comparison Mode: Compare different time periods
- Export Data: Download chart data as CSV
How to Interpret:
Peak Days: Typically mid-week (Tue-Thu)
Average Days: Monday and Friday
Low Days: Weekends
Example Trend Analysis:
Monday:     $250  (Average - Start of week)
Tuesday:    $350  (Above average)
Wednesday:  $500  (Peak - Mid-week engagement)
Thursday:   $450  (High engagement)
Friday:     $300  (Declining towards weekend)
Saturday:   $150  (Lowest - Weekend effect)
Sunday:     $180  (Recovering)
Chart Configuration Tips
- Click on legend items to show/hide specific data series
- Use the date picker to analyze specific time periods
- Export any chart by clicking the download icon in the top-right corner
- Hover over chart elements for detailed tooltips with exact values
Quick Actions
Perform common tasks directly from the dashboard with these quick action buttons and features:
Export Reports
Download dashboard data in multiple formats for further analysis.
Date Range Selection
Filter data by custom date ranges with one click.
Real-time Refresh
Update all metrics instantly with manual refresh button.
Keyboard Shortcuts
| Shortcut | Action |
|---|---|
| Ctrl + R | Refresh dashboard data |
| Ctrl + E | Export current view |
| Ctrl + F | Focus on search/filter |
| Esc | Close modal/clear filters |
Pro Tips
- Bookmark specific date ranges for quick access
- Set up email alerts for metric thresholds
- Use comparison mode to track growth
- Schedule automated report generation
Dashboard Control Panel
These buttons are available in the top-right corner of your dashboard.
Frequently Asked Questions
- CSV: For Excel, Google Sheets, or database import
- Excel (.xlsx): Formatted spreadsheet with charts
- PDF: Printable report with all metrics
- JSON: For API integration or custom analysis
- Date Range: Use the date picker to view specific periods
- Chart Filters: Click legend items to show/hide data series
- Widget Reordering: Drag and drop metric cards (coming soon)
- Chart Types: Switch between bar, line, and pie charts
- Theme: Toggle between light and dark mode
- Go to Account Settings → Preferences
- Select your preferred timezone
- Click "Save Changes"
- Successful payments from all gateways
- Refunds and chargebacks (deducted automatically)
- Currency conversions at real-time rates
- Tax calculations (if configured)
- Promo code discounts
- Revenue Thresholds: Alert when earnings reach specific amounts
- Subscription Milestones: Notify when hitting user count goals
- Payment Failures: Immediate alerts for failed transactions
- Low Stock: For trial or manual subscription limits
- Go to Settings → Notifications
- Select "Dashboard Alerts"
- Configure your alert preferences
- Choose delivery method (Email, Telegram, Dashboard)
- Smartphones (iOS & Android)
- Tablets (iPad, Android tablets)
- Desktop computers
- Laptops
- Touch-friendly charts and controls
- Optimized layout for small screens
- Mobile-specific quick actions
- Offline viewing of cached data
Still have questions?
Check our general FAQ section or contact our support team for assistance. Average response time: 2 hours during business hours.
Was this documentation helpful?
Your feedback helps us improve the documentation.